📌 Problem: Linear Interpolator
You are asked to implement a linear interpolator. Namely you are given n points on a 2-dimensional coordinate system (known as the knot points).
When these points are sorted by their x coordinates and then connected together using straight lines (in their sorting order), they define a piecewise-linear function L(x) known as the linear interpolation.
When x is outside the range of all knot points, L(x) is defined by extrapolation, i.e., extending the straight line connecting its two nearest knot points.
🧠 Function Signature
def linear_interpolate(
    n: int,
    x_knots: List[float],
    y_knots: List[float],
    x_input: float
) -> float
n: number of knot pointsx_knots: list of x-coordinates of the knot pointsy_knots: list of y-coordinates of the knot pointsx_input: the query x-value
Return the value of the interpolated function L(x_input).
🧾 Behavior Rules
- If multiple knot points share the same x-coordinate:
- When
x_input <= x, use the smallest y among those points. - When
x_input > x, use the largest y among those points.
- When
- For extrapolation:
- If
x_input < min(x_knots), use the two smallest x values. - If
x_input > max(x_knots), use the two largest x values. - Follow the same tie-breaking rule as above.
- If
📌 Constraints
1 < n <= 100,000x_knotsandy_knotsare guaranteed to have the same lengthx_knotsandy_knotsare not sorted- You must implement interpolation by hand; do not use any interpolation libraries
- All floats are multiples of 0.001 (equality comparison is unambiguous)
📥 Sample Input
n = 5
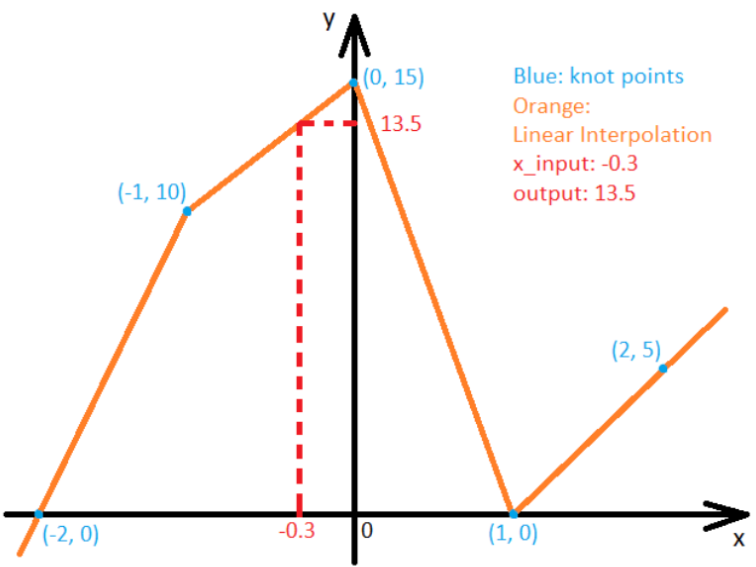
x_knots = [-2.0, -1.0, 0.0, 1.0, 2.0]
y_knots = [0.0, 10.0, 15.0, 0.0, 5.0]
x_input = -0.3
📤 Sample Output
13.5
📈 Explanation
x_input = -0.3 lies between -1.0 and 0.0.
The interpolation is performed on the line segment from (-1.0, 10.0) to (0.0, 15.0) using the linear formula:
So,
Efficient Regression V5
Part One
Implement a function to compute univariate OLS regression coefficients (betas) between pairs of asset returns from two dataframes dfx and dfy, where each column xi in dfx corresponds to column yi in dfy.
Regression form:yi=βi⋅xi
No intercept should be fitted.
def compute_betas(dfx: pd.DataFrame, dfy: pd.DataFrame) -> List[float]
dfx: dataframe with predictor valuesx0toxNdfy: dataframe with target valuesy0toyN- Returns: list of
Nfloat values for each beta.
Part Two
Now compute online (cumulative) betas using a list of batches dfxs and dfys, each being a list of dataframes.
For each batch index j, compute betas using cumulative data from batch 0 to j.
def compute_betas_online(
    dfxs: List[pd.DataFrame],
    dfys: List[pd.DataFrame]
) -> List[List[float]]
dfxs,dfys: lists of DataFrames with aligned shapes- Returns: list of lists of float — betas for each cumulative batch.
Daily Temperature By Town
You are given daily temperature readings for multiple towns and NYC.
Part One:
Answer these questions:
- Town with highest temperature standard deviation
- Median NYC temperature on days when Town2 ∈ [90, 100]
- Sum of absolute regression coefficients from town to NYC (using simple linear regression without intercept)
- Town most predictive of NYC (min MSE with intercept)
- Two towns most predictive jointly of NYC (min MSE with intercept)
def q1_q5(df: pd.DataFrame) -> List
Part Two:
Find 5 towns most predictive of NYC (lowest MSE with intercept, using greedy selection).
def q6(df: pd.DataFrame) -> List
- You must implement a greedy approximation, exhaustive search will time out.
我们长期稳定承接各大科技公司如Visa、TikTok、Google、Amazon等的OA笔试代写服务,确保满分通过。如有需求,请随时联系我们。
We consistently provide professional online assessment services for major tech companies like TikTok, Google, and Amazon, guaranteeing perfect scores. Feel free to contact us if you're interested.