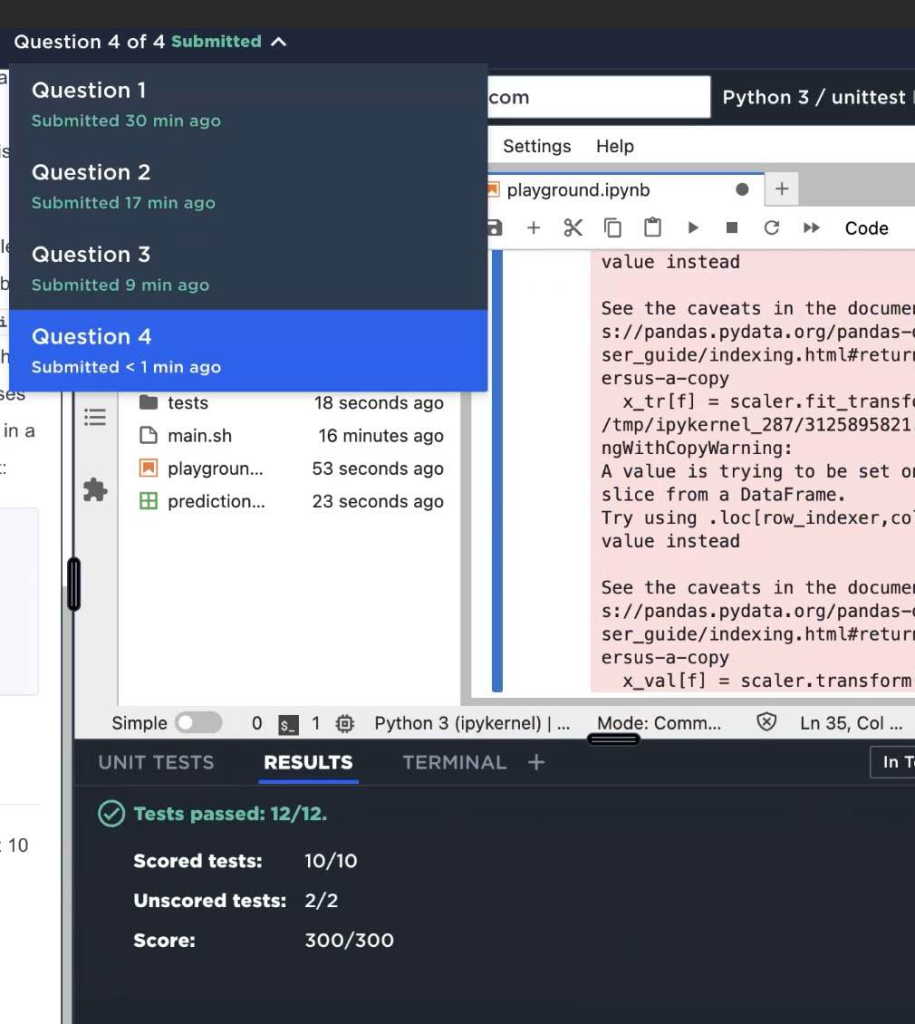
✅ Question 1 of 4
Description
You are provided with datasets containing information about taxi drivers and their rides. Your task is to perform some basic data analysis and save the results to a CSV file.
The data is located in the following CSV files:
drivers.csv:
driver_id(type: int): Unique driver identifier.age(type: int): Driver’s age.second_language(type: str): Driver’s second language. If a driver doesn’t have a second language, the value is"no".rating(type: float): Driver’s average rating.
rides_{i}.csv, split into 4 files (rides_1.csv to rides_4.csv):
ride_id(type: int): Unique ride identifier.driver_id(type: int): Driver’s identifier.passenger_id(type: int): Passenger’s identifier.date(type: str): Date of the ride.status(type: str): Status of the ride; one of["Rejected by the driver", "Cancelled by the passenger", "Success"].
Your tasks are as follows:
1. Calculate the average driver rating
- Compute the average of the
ratingcolumn from thedrivers.csvfile.
2. Calculate the percentage of drivers with a second language
- Determine the percentage of drivers who have a second language (i.e., where
second_languageis not"no"). - Store the result as:
insight_type:"percentage_drivers_with_second_language"value: The calculated percentage.
3. Calculate the ride success rate
- Combine the ride data from all
rides_{i}.csvfiles into a single dataset. - Calculate the percentage of rides that were successful (i.e., where
statusis"Success"). - Store the result as:
insight_type:"ride_success_rate"value: The calculated percentage.
Output Requirements:
- Save the results in a CSV file named
analysis_results.csv. - The CSV file should have two columns:
insight_typeandvalue. - Each row corresponds to one of the tasks above.
- All numeric values will be considered correct if they match the expected values up to two decimal places.
Notes:
- You are allowed to use any Python libraries you want, including
pandas,numpy, andscikit-learn. - Remember to combine the ride data from all four
rides_{i}.csvfiles before performing the analysis. tests/data_analysis_tests_data/expected.csvdemonstrates the expected format of the output file and the expected value ofaverage_driver_rating. Note that the values ofpercentage_drivers_with_second_languageandride_success_rateare shown as zeroes in that file — this is just a placeholder and not the actual expected result.


✅ Question 2 of 4
Description
You are given access to the data containing information about taxi drivers and their rides, created by April 15th, 2023. When calculating any time features, consider April 15th, 2023 as today.
The data is distributed across 6 different files:
drivers.csv:
driver_id(type: int): Unique identifier of the drivercar_id(type: int)age(type: int)started_driving_year(type: int)second_language(type: str): If a driver doesn’t have a second language, the value is"no"rating(type: float)net_worth_of_tips(type: float)driver_class(type: str): One of the following:["A class", "B class"]
rides_{i}.csv, split into 4 files:
ride_id(type: int)driver_id(type: int)passenger_id(type: int)date(type: str)status(type: str): One of the following:["Rejected by the driver", "Cancelled by the passenger", "Success"]car_clearness_upvote_given(type: bool)politeness_upvote_given(type: bool)communication_upvote_given(type: bool)punctuality_upvote_given(type: bool)complaint_given(type: bool)
cars.csv:
car_id(type: int)model(type: str)manufacture_year(type: int)last_inspection_date(type: str)
Your task:
Retrieve the needed information from the data about each driver and store it in the collected.csv file.
Your goal is to obtain a table with the following columns:
driver_id(int)car_model(str)car_manufacture_year(int)days_since_inspection(int): number of days passed since the last inspectionage(int)experience(int): calculated as2023 - started_driving_yearsecond_language(str)rating(float)net_worth_of_tips(float)number_of_upvotes(int)driver_class(str)
You may order rows and columns in any way you find comfortable to work with. Tests are designed to be order-agnostic.
✅ Question 3 of 4
Description
You are given a dataset containing information about taxi drivers and their performance metrics. The dataset includes various attributes for each driver.
The dataset has the following columns:
driver_id(int)car_model(str)car_manufacture_year(int)days_since_inspection(int)age(int)experience(int)second_language(str)rating(float)net_worth_of_tips(float)number_of_rejected_rides(int): number of rides with status ="Rejected by the driver"number_of_upvotes(int)number_of_complaints(int)number_of_incidents(int)driver_class(str)
The dataset is divided into train and test sets:
- Train set: 70% — located at
data/train.csv - Test set: 30% — located at
data/test.csv
Perform the following data preparation steps:
a. Fill missing values in the age column with the mean age of the drivers, rounded to the nearest integer.
b. Convert the second_language and car_model columns into numerical values using ordinal encoding. Encoding should:
- Start from
0 - Be consecutive integers
✅ Correct mapping example:
- "Nissan Altima" → 3
- "Ford Fusion" → 1
- "Honda Accord" → 0
- "Hyundai Sonata" → 2
=> Set: (0, 1, 2, 3)
❌ Incorrect mapping example:
- "Nissan Altima" → 5
- "Ford Fusion" → 4
- "Honda Accord" → 2
- "Hyundai Sonata" → 1
=> Set: (1, 2, 4, 5)
c. Normalize the net_worth_of_tips column using Standard Scaling.
d. Convert the driver_class column into numerical values:
- "A class" → 0
- "B class" → 1
Note: Please ensure not to cause data leakage from the test set into the train set.
After completing all steps, save the processed data to:
processed_train.csvprocessed_test.csv
Ensure that:
- Values in
net_worth_of_tipsare written with exactly 5 digits after the decimal point.
Execution Constraints:
- Time limit: 8 seconds
- Memory limit: 4 GB

✅ Question 4 of 4
Description
Using the cleaned dataset from the prior question, your goal is to train a classifier that can predict whether the driver is of:
- A class (
0) - B class (
1)
This is a free-form task — use any machine learning model or Python libraries.
Dataset:
The test set from the previous task is split into:
- Training set: 70% (
data/train.csv) - Validation set: 15% (
data/val.csv) - Test set: 15% (
data/test.csv)
Your task:
Predict classes of drivers from test.csv with the lowest possible error.
Use these metrics:
precisionrecall
✅ B class is the positive class.
Goal:
Maximize recall, while keeping precision relatively high
Once satisfied with validation set performance, submit predictions for test set in:
predictions.csv
With the format:
driver_class
0
1
0
...
Scoring the solution:
- Only the first 10 rows of test data are scored immediately
- Submit to check score on the full dataset
Execution Constraints:
- Time limit: 8 seconds
- Memory limit: 4 GB

我们长期稳定承接各大科技公司如Capital One、TikTok、Google、Amazon等的OA笔试代写服务,确保满分通过。如有需求,请随时联系我们。
We consistently provide professional online assessment services for major tech companies like TikTok, Google, and Amazon, guaranteeing perfect scores. Feel free to contact us if you're interested.
